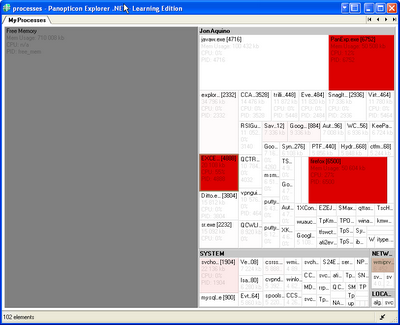
(Windows) Treemap visualization of memory and CPU utilization
Panopticon Explorer is a free Windows tool for visualizing memory usage and CPU utilization. Memory usage is shown as a treemap: the more memory a process consumes, the bigger its box on the display. CPU utilization is shown with color: the more CPU, the redder the box.
Tips:

Tips:
- To see the memory/CPU display, go to Favorites > Shortcuts > My Processes
- Turn off the menus and sidebars by clicking the icon at the lower-right corner
- Save your configuration by clicking File > Save Workbook. You can then double-click the file and it will show the tool with the menus and sidebars removed, etc.
posted by Jonathan at
3/02/2007 01:37:00 a.m.
![]()
![]()


2 Comments:
Just came across your site today and it's a great visual of the usage of our software. This is one of the favorites that is packaged as easy real time examples within the desktop version of our software. There's a lot more to the product (data connections, views, bucketing, actions, etc.) that can be applied to different data sets so I'd suggest dropping formatted excel sheets onto the app and playing with the settings. You might be surprised what you find. You can also contact me anytime for some more personalized help on this.
Cheers,
//Marcus Eder
PS - I work as a pre-sales consultant with Panopticon in NYC, originally from North Van.
By Anonymous, at 4/23/2007 8:10 a.m.
Hi Marcus - North Van - sweet!
By Jonathan, at 4/23/2007 7:42 p.m.
Post a Comment
<< Home