Treemap To Visualize Memory Usage: Panopticon (Windows Freeware)
This is something I've always wanted. It's a Windows freeware product called Panopticon Explorer for visualizing your computer's memory and CPU usage in the form of a treemap. In the screenshot below, the larger the box, the more memory being consumed by the process; and the redder the box, the more CPU resources it is using (it's updated in real time).
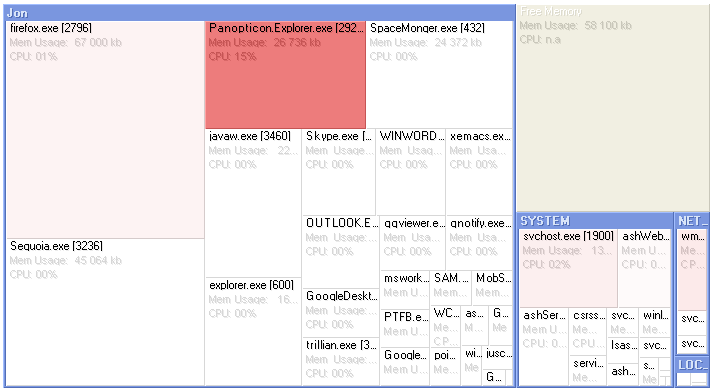
Note that Panopticon Explorer can also be used to display a treemap of your hard drive, but I do not recommend using it to scan your whole hard drive. It is an alpha release and takes forever if you scan your whole C: drive -- performance is fine for visualizing small- to medium-sized directory trees however. And of course, it's great for visualizing your computer's memory, as shown above.
Markus Skyttner tells me that the memory problems will be fixed before they officially release the software in the summer.
posted by Jonathan at
4/09/2005 04:12:00 p.m.
![]()
![]()


15 Comments:
Hi Jon,
in what sense is memory set up as a tree? I guess I could see a process tree in a Unix operating system, but I don't quite get how Panopticon defines its tree, particularly for Windows. Just curious.
Glad I found your blog! Not before I stumbled on some other jaquino with a blog devoted to a his gambling addition, though.
Cheers, Djun
By Anonymous, at 4/09/2005 7:36 p.m.
Hi Djun - Great to hear from you! In the case of memory "treemap" is a bit of a misnomer -- it's like a 1-level tree in this case. But the visualization is still cool because it shows you at a glance which processes are taking up the most memory -- the more memory, the bigger the rectangle.
By Jonathan, at 4/09/2005 7:40 p.m.
This reminds me of a neat trick that data visualization researchers are playing around with these days.
I forget what they call it, but the concept basically involves using the size (as well as color, shape, etc.) of visualized data points, as on a scatter chart, to display multiple dimensions of the related data at each point.
The end effect is really cool. One researcher even encoded the dimensions of his data as facial elements on smilies! If I remember correctly, each eye, the nose, and each side of the face represented a dimension of its own.
I think he even got it so that the "sad" looking faces were from one end of the spectrum of data and the "happy" looking ones were on the other. Really amazing stuff. (Sorry I don't have links. I'm not even sure it's online at all, sadly.)
By Darren Torpey, at 4/13/2005 9:32 p.m.
Hm! I think I might have seen that smiley chart somewhere. Why not? Smileys can be a dimension ;-)
By Jonathan, at 4/13/2005 9:34 p.m.
As soon as you mentioned that you are into information visualization ... that's it. I'm subscribing to your blog.
By Jonathan, at 4/13/2005 9:35 p.m.
Cool. Hopefully in time we can both learn from the other, or at least help broaden each others' perspectives on our favorite topics. ;)
Actually, now that it comes up this way...
I've been wanting to post on my blog about how what I've been seeing from the data vis field has lead to some (possibly) important ideas relating to games. Perhaps now's a good time to get on that...
By Darren Torpey, at 4/15/2005 4:37 a.m.
Ooh - data visualization + video games. I'd be interested in that (mostly on the data visualization side).
By Jonathan, at 4/16/2005 8:25 a.m.
This product does not seem to be available anymore. Does anyone know where I can get a copy of this? I tried their earlier product and am anxious to see how this one differs. Thanks.
By Anonymous, at 12/24/2005 7:27 a.m.
Not available anymore? That's too bad. Anyway at least SpaceMonger is still available (treemap of hard drive usage)
By Jonathan, at 12/24/2005 4:09 p.m.
in case you still care,
the multidimensional smilies are called chernoff faces
By Anonymous, at 3/02/2006 4:31 a.m.
Thanks anon!
By Jonathan, at 3/02/2006 9:41 p.m.
This is just to inform that Panopticon Explorer is still available for download for non-commerical use, in a so called Learning Edition. The URL is www.panopticonexplorer.com
By Anonymous, at 3/01/2007 6:29 a.m.
And a hyperlink might be useful:
www.panopticonexplorer.com
By selecting Favorites, Shortcuts, My Processes, you will see a visualization of your computer's Memory usage, CPU usage etc. It can also show the more truthful VM Size instead of Memory Usage.
By Anonymous, at 3/01/2007 6:33 a.m.
Super! Downloading it now.
By Jonathan, at 3/02/2007 12:30 a.m.
Good idea. Looking for same for Linux.
And yes - a process _tree_. There can be a situation when no single process eats too much memory or CPU however the resources are consumed by multiple small processes. Treemap would help to identify process groups that eat too much resources as a whole.
By Alexey Tigarev, at 10/31/2010 1:07 p.m.
Post a Comment
<< Home